April 2026 GB Solar Forecast update: Accelerated buildout, lower capture rates
April 2026 GB Solar Forecast update: Accelerated buildout, lower capture rates
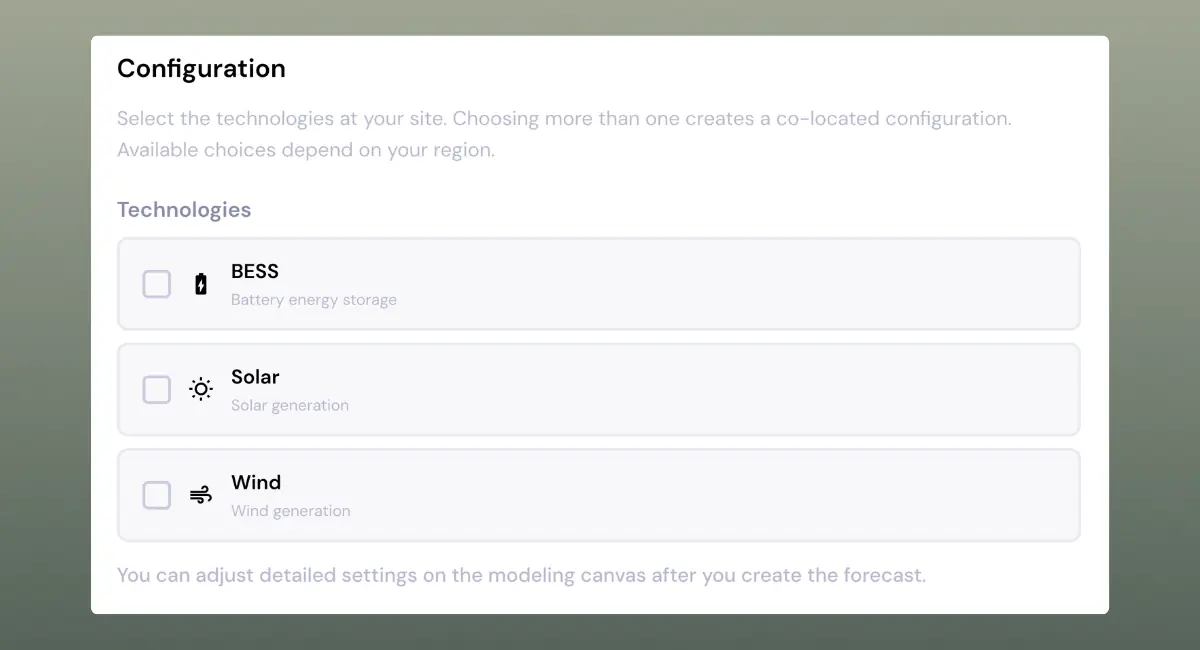
Modo Energy's April 2026 GB forecast release for solar is out.
Solar capture rates are projected at 85% in 2026, falling to 58% by 2035. Capture prices fall in step over the same period. The key drivers are an accelerated near-term buildout from the latest Contract for Difference (CfD) rounds and lower solar CapEx. The removal of Carbon Price Support also lowers near-term wholesale prices.
Key takeaways
- GB solar capacity reaches 36 GW by 2030 and plateaus at 92 GW from 2051, as falling capture prices erode the incentive to keep building beyond that level.
- Rapid near-term deployment drives solar cannibalisation. Capture rates fall from 85% in 2026 to around 58% after 2035 as more solar chases the same load.
- Near-term wholesale prices reflect falling UK Emissions Trading Scheme (ETS) carbon prices and the removal of Carbon Price Support (CPS) from April 2028.
- The April-26 low scenario cuts solar capture prices to £33/MWh by 2040, around 20% below the central.
Near-term solar buildout rises sharply, but the long-term ceiling falls
GB solar capacity grows from 23 GW in 2026 to 53 GW in 2035. Across Europe, solar continues to be built at pace. Germany hits 175 GW and Spain 57 GW by 2030.
The GB forecast incorporates the latest CfD rounds, adjusted to reflect connections reform. We expect to hit 36 GW by 2030, against the Clean Power 2030 target of 45-47 GW.
Long-term, capacity plateaus at 92 GW from 2051. Cannibalisation deepens through the 2030s. By 2050 we see no new build sites despite falling CapEx.
Lower modelled solar CapEx, based on new inputs from the IRENA 2024 dataset, averaging €660/kW across 2026-35, is a key driver of buildout in European solar markets.
Capture rates are up to 16% lower than the January release by 2030
In the central scenario, the capture rate falls from 80% to 67% by 2030. The low scenario tracks closely, reaching 65% in 2030.
Near-term solar capacity growth is the primary driver. More solar chasing the same load pushes the capture rate down before storage deployment catches up.
Falling carbon prices and the removal of Carbon Price Support (CPS), a levy on fossil fuels used in power generation, from April 2028 put near-term wholesale prices around 5% below the January release. Both feed directly into capture prices, which reach £53/MWh by 2030 and £41/MWh by 2040 in the central scenario. The low scenario is around 20% below this, falling to £33/MWh in 2040.
CfD revenues fall from £59k to £42k/MWp across the 15-year term as negative prices erode returns
Lower near-term wholesale prices feed directly into project revenue. A 100 MWp site commissioning in 2028 with 80% of capacity under a 15-year CfD at the AR6 strike of £71.5/MWh generates £59k/MWp in year one. Revenue declines gradually as capture rates fall, reaching £42k/MWp by 2042.
At the CfD expiry in 2043, revenue drops to £36k/MWp. The site moves fully to merchant, and without the CfD floor, declining capture prices feed directly into total project returns.
The main driver for falling CfD revenues is negative prices. When the day-ahead price falls below zero, no CfD payment is made. As more solar comes onto the system, negative price hours increase, cutting into CfD revenue across the term.
What falling capture prices mean for GB solar developers
Solar is reaching the system faster and at a lower cost. Capture rates are projected to fall as a result.
By 2050, we project the solar fleet to reach 90 GW. Beyond that point, even with falling CapEx, falling capture prices make further build uneconomic.