Watch: Bring your own power - how data centers navigate grid queues
Watch: Bring your own power - how data centers navigate grid queues
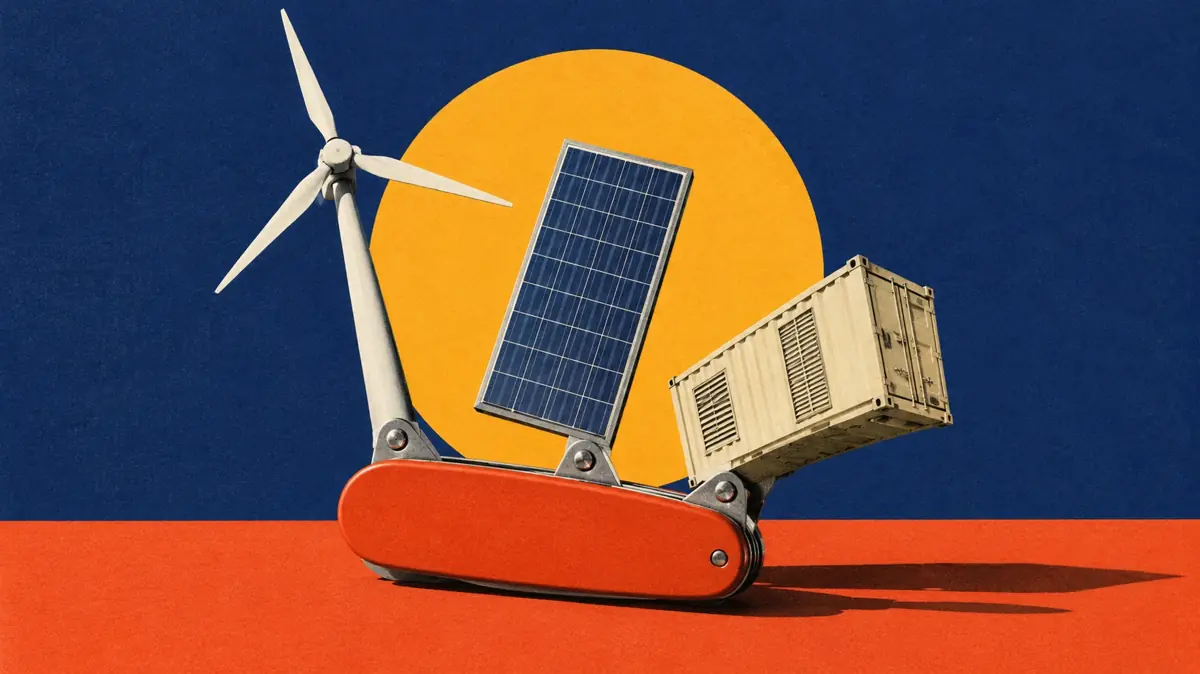
Bring your own power (BYOP) means a data center builds its own generation on site, in order to start operating sooner - rather than wait in the grid interconnection queue. It has taken off as a concept because AI demand is growing faster than grids can power new data centers. These delays can mean billions in lost revenue every year, which is why speed-to-power is so crucial. A new generator in PJM now takes an average of 8 years to reach power, up from under 2 years in 2008 (RMI, 2025). Modo Energy puts the all-in grid cost for a 100 MW PJM data center campus at $80 to $85 per MWh in 2027 (Modo Energy, 2026).
In the video below, Alejandro de Diego - Market Analyst at Modo Energy - explains “bring your own power”.
Key takeaways
- Connection delays are the main reason for the BYOP drive. A new PJM generator now takes about 8 years to reach power, up from under 2 years in 2008.
- There are multiple pathways for a data center to access the power it requires. On-site bridge power can reach first output in 1 to 2 years, and a standalone off-grid plant runs about 3 to 5 years. Both beat waiting on a grid connection.
- The economics favor speed. At $10 million to $12 million per MW a year, a campus loses more by waiting than it saves on cheaper power.
- But self-supply does not cancel the grid bill. Minimum-demand charges keep running even when on-site power carries the load.
- The rules are being rewritten while developers commit. FERC set PJM to work on co-location rules in December 2025, then widened it to six grid operators in June 2026.
What does "bring your own power" mean for a data center?
Bringing your own power means a campus builds or contracts new generation to serve its own load (i.e. electricity used; demand), instead of drawing it from the wider transmission and distribution grids. It’s also sometimes called ‘bring your own generation’ (BYOG), or ‘bring your own capacity’ (BYOC).
These labels cover several very different arrangements. But, essentially, these are just new way of describing large-scale, behind-the-meter (BTM) generation - which has been brought on by concerns around surging demand growth caused by the AI boom, and the subsequent rapid buildout of data centers.
So, what options does a data center have for accessing the power it needs to run?
1. Full grid connection
A full grid connection means the campus takes all its power over the transmission and distribution network. It joins the interconnection queue, waits for the studies and any network upgrades, then pays network and tariff charges for as long as it operates. Large load tariffs often have decade-plus contract terms, up front collateral obligations, and long lead times. That wait comes at a huge opportunity cost to the data center (the boom is happening right now). and that’s what BYOP tries to circumnavigate.
On top of this, data center developers and owners are dealing public data center backlash - and the subsequent policy volatility. With concerns over rising household bills due to increased electricity demand, regulators are attempting to find fair ways to allow data centers to come online, without forcing the cost onto the average consumer. The opportunity cost for the data center plus the increased grid costs of massive demand growth are what BYOP is designed to circumnavigate.
2. Behind-the-meter generation vs. co-location
Behind-the-meter generation sits on the customer's side of the meter and feeds the load directly, taking no transmission service for that power. Co-location is messier. The plant and the campus share a site, but under FERC's current reading the load usually stays a transmission customer and keeps paying for some grid service. The line between those two is one of the things regulators are actively rewriting.
What matters for a developer is where the arrangement ends up. A bridge build runs on-site power first, then connects to the grid once the queue clears, so first megawatts arrive years before the grid link. Sometimes that eventual connection has a firm target, and sometimes its timing is left open. A fully islanded campus is the other end of the range. It takes nothing from the grid at all, treats on-site generation as its permanent and only supply, and never joins the queue.
Why are developers bringing their own power?
Because waiting has become expensive. A wave of new demand, led by AI data centers and other new industrial load, has outrun how fast grid operators can connect it. Rather than sit in a queue, a developer can build on site and reach power years sooner.
Developers reach for it for three reasons, two of which are familiar and one of which is the result of the AI race. Reliability is the oldest. Hospitals and other critical sites have long run on-site generation for backup. Access is the second, for a site the grid cannot connect at all. Speed is the third, and it’s why you’re suddenly hearing about BYOP everywhere. Behind-the-meter plants have always existed. The interconnection bottleneck is what pushed them into the headlines.
But queues also oversell what is coming. In ERCOT, large-load interconnection requests reached 226 GW in a November 2025 snapshot, up from 63 GW a year earlier (Latitude Media, 2025). Counted by the year each project says it will connect, the same queue reaches about 200 GW by 2030, well above ERCOT's all-time peak demand. Modo Energy expects data centers to add about 11 GW to ERCOT's system peak by 2030, and about 17 GW by 2035, a fraction of the queue (Modo Energy, 2026).
In PJM - home to “Data Center Alley” in Northern Virginia - developers have submitted about 60 GW of large load for 2030, of which PJM has accepted 34 GW. Modo Energy's realistic view is 38.8 GW of data center demand by 2030, up from 8.2 GW operating in 2025 (Modo Energy, 2026). The queue reads as a map of congestion, not a forecast of real load. Developers stack speculative and duplicate requests to hold a place. The squeeze is worst where data centers and factories cluster: that aforementioned PJM's Virginia corridor, north and west Texas, and increasingly SPP.
The same story shows up across every number that decides a project, from connection times to turbine lead times to the delivered price of grid power.
| Metric | Figure | As of | Source |
|---|---|---|---|
| PJM time to power, new generation | About 8 years, from under 2 years in 2008 | 2025 | RMI |
| On-site bridge power, time to first output | 1 to 2 years | 2026 | S&P Global, EPRI |
| On-site plant as sole supply, time to power | About 3 to 5 years, turbine wait included | 2026 | Stout / GE Vernova |
| ERCOT large-load queue | 226 GW in Nov 2025, from 63 GW a year earlier; about 200 GW requested by 2030 | 2025 to 2026 | Latitude Media, ERCOT |
| ERCOT data center peak contribution | About 11 GW by 2030, about 17 GW by 2035 | 2026 | Modo Energy |
| PJM large load requested, 2030 | About 60 GW submitted, 34 GW accepted | 2026 | Modo Energy; PJM |
| PJM projected data center demand, 2030 | 38.8 GW, of which 32.7 GW in a large-load-tariff zone | 2026 | Modo Energy |
| PJM load growth, 2024 to 2030 | About 32 GW, most of it data centers | 2026 | Modo Energy |
| 100 MW PJM campus, all-in grid cost | $80 to $85 per MWh | 2027 est. | Modo Energy |
| PJM around-the-clock price, peak | $87 per MWh in 2032 | Jul 2026 | Modo Energy |
| On-site CCGT capital cost | About $1,400 per kW | 2026 | Stout |
| New heavy-duty gas turbine lead time | 3 to 4 years, booked into 2029 to 2030 | 2026 | GE Vernova |
| Estimated AI data center revenue | About $10 million to $12 million per MW a year | 2026 | Cleanview |
This all makes self-supply expensive. But it also makes it the fastest way to hit a schedule when the grid is most of a decade out. And the cost of missing out on operationsdecidedly outweighs the cost of building on-site generation. Announced behind-the-meter projects already exceed 90 GW, more than a quarter of the US data center pipeline, though only about 2% of that is running so far (Cleanview, 2026).

PJM is on track to serve over 1,000 data centers by 2030
Modo Energy's breakdown of PJM data center growth to 2030, and the utilities and corridors where the load actually concentrates. Read more →
A 100 MW campus reaches power years sooner on-site, and still owes most of the tariff
On-site generation is often a way to buy time, though some campuses run on it permanently. The power itself is rarely cheaper once the capital is counted. And the utility contract does not vanish just because the campus makes its own electricity. So, what happens to a modeled 100 MW data center campus in PJM?
| Lens | Grid-only | Bring your own power (on-site gas) |
|---|---|---|
| Time to power | About 8 years for a new generator (RMI, 2025) | 1 to 2 years to first bridge power, about 3 to 5 years for a standalone plant |
| All-in grid cost | $80 to $85 per MWh in 2027 (Modo Energy, 2026) | Reduced grid draw, but the tariff floor still applies |
| Up-front capex | None; pays network and tariff charges | About $140m at $1,400 per kW (Stout, 2026) |
| Residual utility cost | Full tariff | AEP Ohio's $6.74 per kW-month demand charge is about $80m over 12 years for 100 MW (Modo Energy, 2026) |
| Revenue while waiting | About $1bn a year foregone at $10m to $12m per MW (Cleanview, 2026) | Captured years sooner |
Under most large-load tariffs, the minimum-demand charges and revenue guarantees keep running whatever the on-site plant does. A campus generating most of its own power still owes much of what it signed up for (Modo Energy, 2026).
Even so, the sums are lopsided. At $10 million to $12 million per MW a year (Cleanview, 2026), a 100 MW campus gives up something like $1 billion for every year it sits without power. That makes the generation premium look tiny next to several years of lost output. And it explains why developers would prefer to build now, rather than wait.
The largest AI builders have already picked the path. Microsoft and Chevron announced a 2 GW data center with a co-located behind-the-meter gas plant at Pecos, Texas, on a 20-year agreement (Orrick, 2026). Crusoe and OpenAI are building 4.5 GW of gas at Abilene (Data Center Frontier, 2026). Meta secured 2,200 MW of new gas through Entergy Louisiana (LPSC, 2025). Talen and Amazon restructured to a 1,920 MW front-of-meter nuclear deal after FERC rejected their behind-the-meter arrangement at Susquehanna in November 2024 (Utility Dive, 2025).
For live PJM prices and forecasts, the Modo Energy Terminal carries the settlement data and the forward model behind these figures.
How do data centers pay for power in PJM?
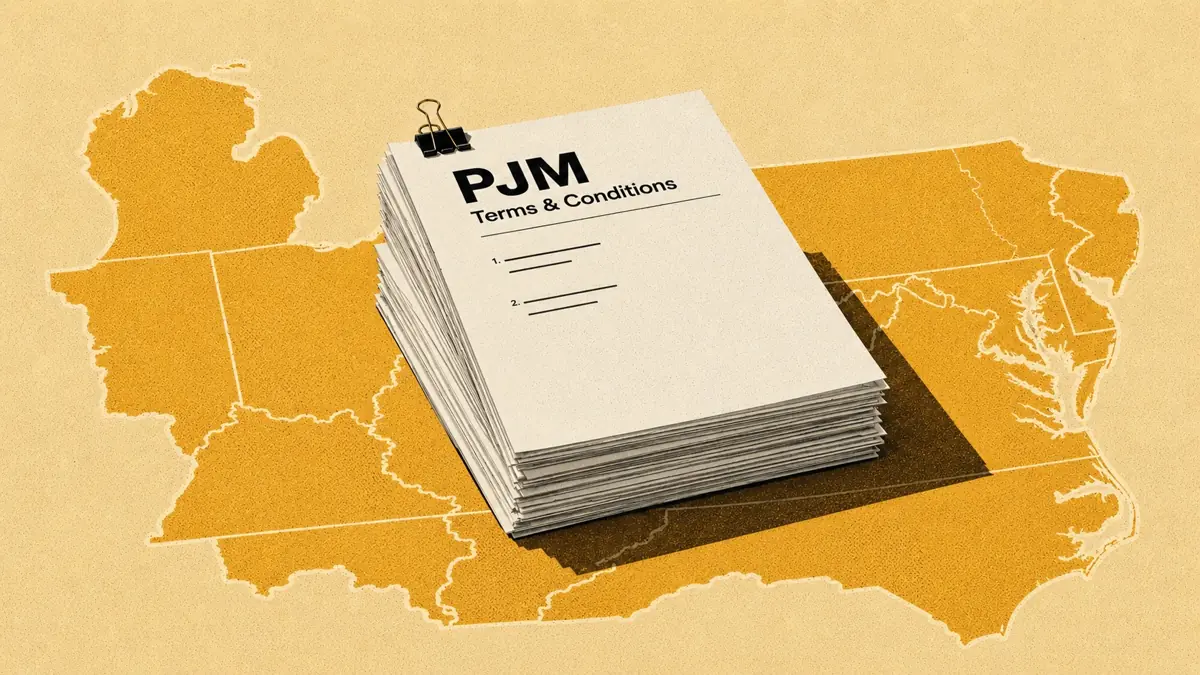
Modo Energy's zone-by-zone model of what a PJM data center actually pays, from the delivered price to the minimum-bill floor. Read more →
 Free guide from Modo EnergyPutting AI to work in energy investment and asset managementSizing up data-centre demand and its market impact? A practical playbook for using AI tools across your energy investment and operations teams, featuring tangible, timesaving tips and tricks you can put to use immediately.Download the guide →
What are the trade-offs of bringing your own power?
Bringing your own power trades a large capital expense and some real risk for speed and control. Whether that trade is worth it comes down to the site and, increasingly, to whether the developer can procure generation at all.
| Pros | Cons |
|---|---|
| Reaches power years sooner than the queue | Large up-front capital and financing |
| Reduces grid draw and some network charges | Gas turbines are scarce, with about a 3-year wait (GE Vernova, 2026) |
| Control over uptime toward 99.999% | A fully islanded campus carries no grid fallback |
| Can earn curtailment credits in some markets | Minimum-demand charges still follow the tariff (Modo Energy, 2026) |
| Insulates a schedule from queue delay | Stranded-asset risk if the rules move against it |
Turbine availability is another major bottleneck. Heavy-duty slots are now booked into 2029 and 2030, and run three to four years from order to delivery (GE Vernova, 2026). The campuses with supply already locked in are simply ahead of the ones still ringing round manufacturers. While early movers were able to secure orders for more efficient, high-rated turbines, later entrants have been forced to look at less efficient engines with much lower ratings. This means juggling service contracts, land, and maintenance on hundreds of engines per site at a GW-scale data center.
How are the rules changing?
Federal and state rules for large loads are being rewritten at the same time, and some of the questions that decide a BYOP project's economics still have no settled answer.
FERC set the process going on 18 December 2025, ordering PJM to write rules for co-located load and behind-the-meter generation (Docket EL25-49). On 16 April 2026 it approved, in principle, several faster routes for co-located load: reduced-capacity interconnection, provisional service, surplus interconnection service, and accelerated processing through its early decision points (National Law Review, 2026). No end-to-end timeline is published for any of them yet, and the detailed PJM filings are still going back and forth.
Then on 18 June 2026 it widened the net. It told all six of the grid operators it oversees, PJM, MISO, SPP, NYISO, ISO-NE, and CAISO, to justify or rewrite their large-load rules by mid-August (Holland & Knight, 2026).
The states are all over the place, and the BYOP label fits almost none of them cleanly.
| Jurisdiction | Mechanism | Status |
|---|---|---|
| Texas (SB6) | Large-load curtailment plus disclosure at 75 MW and above; queue audit ordered 3 Aug 2026 | Law; final rule pending; queue under audit |
| Texas (16 TAC 25.194) | Proposed entry bar for the large-load queue: study-fee deposits, financial security per MW, site control | Proposed March 2026, not final |
| Ohio (AEP tariff) | Minimum-take of 85%, terms up to 12 years | Approved, in effect |
| Georgia and Indiana | Minimum billing, long terms, exit fees | Approved |
| Pennsylvania | Model large-load tariff | Final but voluntary |
| Connecticut | True self-supply mandate | Failed 2026 |
| Virginia | Cost-allocation bills | Failed 2025 |
| New York and Michigan | Data center moratorium bills | Proposed, July 2026 |
Texas SB6 sometimes gets called a BYOP law, but that is a misunderstanding of its impact. It actually makes large loads disclose any on-site generation and curtail in an emergency (McGuireWoods, 2025).
Ohio, Georgia, and Indiana went another way. Their minimum-take tariffs bill a big customer for the capacity it reserves - whether it draws the power or not (Power Magazine, 2026). The one genuine self-supply mandate, Connecticut's, would have made large users bring matching new generation. It never reached a vote in 2026 (CT Mirror, 2026).
Texas has cooled too. On 3 August 2026 the governor ordered an audit of the ERCOT queue and paused the next round of studies. A proposed rule would put a financial bar in front of the queue that today lets anyone in for free (Power Magazine, 2026).
So a BYOP business case now has to clear a moving target. It has to still add up under rules that might read differently a year from now. And that’s a real risk for lenders.
Why is data center load a premium offtake for generators and storage?
For anyone who already owns power or a decent queue position, that delay presents an opportunity. A campus that has to have firm supply in 2 to 3 years is unlikely to haggle hard on price. Beggars can’t be choosers.
Generators already running, or close to it, can sell straight to a campus under a co-location deal, usually at a premium to the wholesale price. They also pick up an offtaker that badly wants reliability. Ultimately, any major change in society comes with challenges and opportunities. And, the bigger the change, the bigger that opportunity is. Despite the policy uncertainty, and the public backlash, the AI boom doesn’t appear to be going anywhere soon. Those that adapt fastest have a huge amount to gain.
Frequently asked questions
What is the difference between behind-the-meter and co-location for a data center?
Behind-the-meter generation sits on the customer's side of the meter and feeds the load directly, without taking transmission service. Co-location places the load at a generator's site, but under FERC's current reading it usually stays a grid customer and keeps taking some transmission service. The line between the two is one of the things regulators are actively rewriting.
Does any US state require data centers to bring their own power?
Not fully, as of August 2026. Texas SB6 makes large loads disclose their on-site generation and curtail in emergencies, but stops short of forcing them to self-supply. Connecticut floated a genuine self-supply mandate in 2026 and it failed. Most states use minimum-take tariffs instead, protecting other customers from the cost of a load that never shows up.
How much faster is bringing your own power than waiting for the grid?
A new grid generator in PJM now takes about 8 years to reach power (RMI, 2025). On-site power is faster in two forms: bridge generation can deliver first output in 1 to 2 years, and a standalone plant built as the sole supply runs about 3 to 5 years once the turbine wait is counted. Either way the gap of several years is the case for self-supply, because each year of delay costs an AI operator an estimated $10 million to $12 million per MW of revenue (Cleanview, 2026).
Does bringing your own power avoid the utility bill?
Usually not. Minimum-demand charges and revenue guarantees follow the service agreement even when on-site supply serves most of the load (Modo Energy, 2026). Building your own generation trims the grid draw and some network charges, but it rarely releases a campus from the tariff it signed to secure a connection in the first place.
What tool can I use to get live and forecast data on US power markets and data center load?
Ko is Modo Energy's AI assistant, built on proprietary revenue data and forecasts for grid-scale BESS and solar across all seven US ISOs and RTOs, Great Britain, Germany, Spain/Iberia, Italy, France, and Australia. It covers wholesale price forecasts, market design, regulation, and policy out to 2050 — a practical tool for revenue modeling, project development, and regulatory analysis.
Modo Energy is the independent benchmark for battery energy storage revenues and buildout across the US, Great Britain, Europe, and Australia. For live PJM data and long-range forecasts, explore the Modo Terminal.
About the author: Neil Weaver is a Power Market Analyst at Modo Energy. Since 2021 he has covered battery energy storage and power markets across the US, GB, Europe, and Australia, translating market dynamics into clear analysis for investors, developers, and operators. He is the writer and presenter of The Energy Academy: Great Britain (watch on YouTube). Find Neil on LinkedIn.
Related articles
- PJM June 2026 benchmark: real-time TB4 fell 9% year-on-year to $473/MW-day
- PJM's 2028/29 capacity auction: prices remain at the cap
- PJM Market Outlook Report July 2026
- The four states supporting BESS in PJM
- ERCOT battery storage in 2026: 7 things to watch (sibling series)
Have a data center power question?
Ko is Modo Energy's AI analyst, built on proprietary US power data and forecasts, answering data-center and interconnection questions with sourced numbers.
Meet Ko →