How to use Ko to analyze large load energy cost forecasts
Modo Energy’s large load energy cost forecast helps you understand the cost of powering a campus. Configure the load, grid connection, and on-site generation assets, then see how electricity prices and the applicable tariff shape the result.
Our global fundamental model optimizes how generation, storage, and grid supply work together to serve your load at the lowest cost, within your site’s technical limits.
Ko brings that analysis into a conversation. You can create and launch forecasts in chat, query completed results, compare options, and create a report from your findings.
Key takeaways
- Create a campus forecast in Ko and review the configuration before running it.
- Understand the cost of serving your large load and how utility tariffs affect the result.
- Compare locations, asset configurations, and market scenarios.
- Create a report with cost comparisons, charts, and the assumptions behind your findings.
Note: Ko can only analyze runs in your own forecast library. Replace the examples below with your project details and name the runs you want to compare.
1. Plan your campus and run a forecast in Ko
Give Ko the details that define your campus: location, electricity demand, grid connection, and any generation or storage.
You can set the campus’s nameplate capacity and choose whether its load is curtailable. Enabling curtailment lets you specify a turn-down cost.
You can also configure the grid import limit and connection voltage, select a tariff, and add on-site generation or storage. Ask Ko to explain any settings you need help choosing.
Try asking Ko:
Review the configuration in the confirmation window and launch the forecast.

2. See what drives your campus energy costs
Once the forecast completes, ask Ko how much it costs to serve each MWh of load. The cost breakdown shows which components contribute to the total.
Compare the total cost in dollars per megawatt-hour (USD/MWh) with the day-ahead electricity price. Ask Ko to explain how the tariff and campus configuration account for the difference.
Try asking Ko:
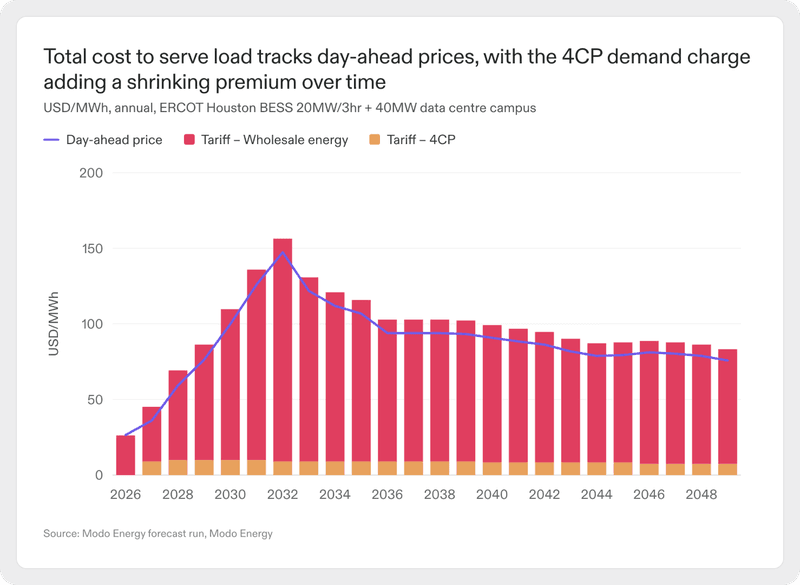
You can also ask Ko to show the campus’s total annual energy costs and explain how they change over time.
Then go deeper:
3. Compare ways to power the same campus
You can compare grid supply with different combinations of on-site solar, wind, and batteries. Run a separate forecast for each configuration to see how it changes campus energy costs.
For each run, the model optimizes how the assets operate around power prices, tariff charges, and technical limits. A battery can shift grid purchases away from expensive periods or help reduce tariff-related costs.
Try adding solar, changing its capacity, comparing batteries with different power ratings or durations, or combining generation and storage. Keep the load, tariff, and market outlook consistent so you can assess the effect of each change.
Note: If you are running a configuration that involves wind, use the forecast creation flow in the Terminal rather than Ko. Once the run completes, you can analyze the results in Ko.
Try asking Ko:
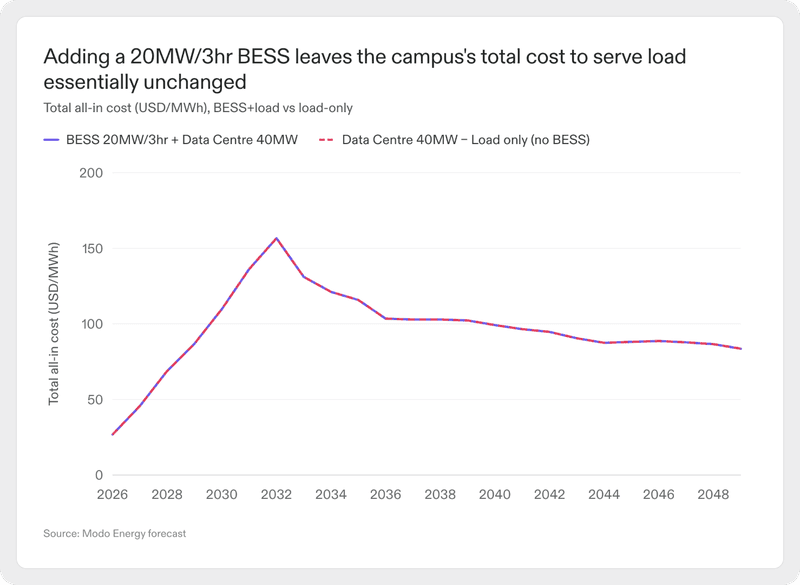
An asset’s value may appear as a reduction in another cost component. Solar, for example, can reduce wholesale purchases. Comparing runs with and without the asset helps reveal those savings.
Then go deeper:
4. Understand tariffs and commercial terms
You can model the price of utility-supplied electricity using the tariff for your site. The tariff captures how energy consumption, grid demand, and other billing rules contribute to campus costs.
Ask Ko to explain the selected tariff and which charges drive the result. The relevant terms depend on your utility or retail supplier and the service arrangement for your site.
Try asking Ko:
Understanding these rules helps you assess which costs could change when you add generation or storage, or adjust how much electricity the campus draws from the grid.
Then go deeper:
5. Compare candidate locations
You can compare the cost of powering the same campus at different locations. Run a separate forecast for each site, keeping the load, on-site assets, and market outlook consistent.
Once both runs are complete, ask Ko to compare the results. Differences in electricity prices, grid connections, and tariffs can help explain why one site costs more to supply.
Try asking Ko:
You can then bring in Modo Energy’s research to understand the wider market context behind each location.
Then go deeper:
Use the comparison alongside your assessment of land, construction, and grid connection requirements.
6. Test different market scenarios
You can run the same campus under different market outlooks to understand how its future energy costs could change.
Central represents Modo Energy’s base-case market outlook. Where available, Low and High test alternative assumptions such as lower or higher fuel prices and demand growth.
Create a separate run for each selected world view, keeping the campus configuration and tariff consistent. Then ask Ko to compare the results.
Try asking Ko:
Once the runs complete, look at both the annual costs and the difference over the full comparison period.
Then go deeper:
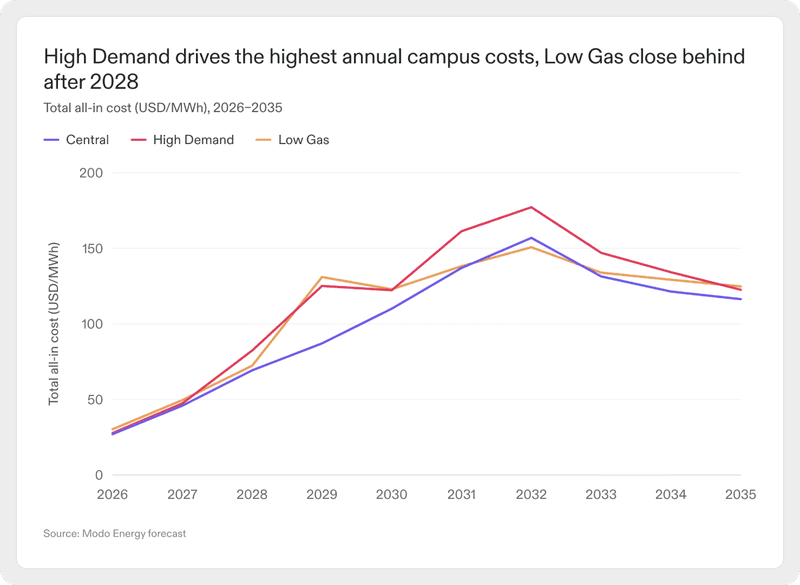
Ask Ko which market assumptions explain the differences in campus costs between your selected scenarios.
7. Create a report from your forecast analysis
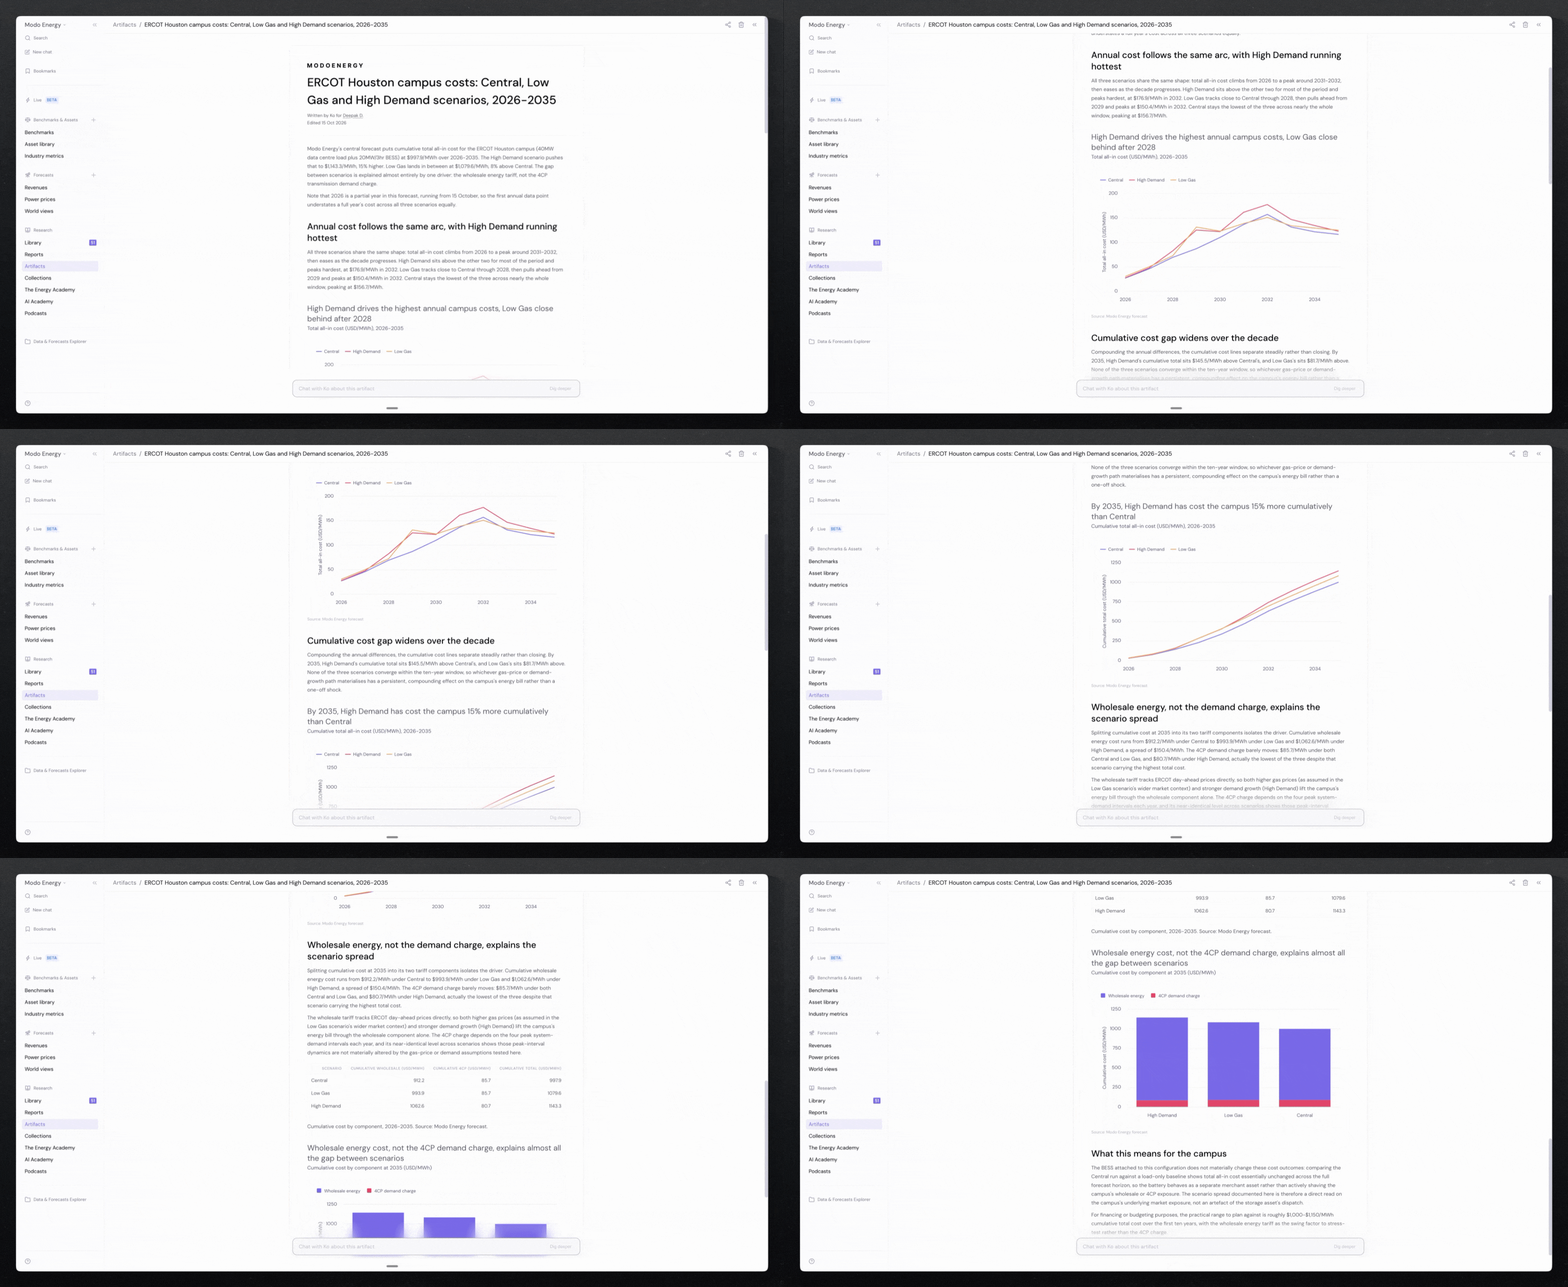
You can ask Ko to turn your forecast comparisons into a report. Bring together the campus configurations, cost charts, and findings your team needs to review.
Name the runs to include and explain who the report is for. A development team might need a comparison of candidate sites, while an investment team might want to understand the costs of different campus configurations.
Try asking Ko:
Use a follow-up to focus the report on the decision your team needs to make.
Then go deeper:
Review the cited sources and run configurations before sharing the report. Your team can then trace the findings back to the underlying analysis.