Live market data is now on the Modo Energy Terminal
Live market data for real-time and day-ahead prices, the generation mix, and load is now available across seven US ISOs: ERCOT, CAISO, SPP, MISO, PJM, NYISO, and ISO-NE.

Why it’s useful
Whether you’re an asset owner, operator, or market analyst, here are a few things you can do with it:
- Understand what's driving the market. Read the generation mix to see which fuel is setting the price, and spot negative pricing when renewables flood the grid.
- Optimize your dispatch. Position on day-ahead before gate closure, fine-tune intraday on real-time, and watch load against forecast to time the evening peak.
- Benchmark and diagnose your asset. Benchmark against the index, then use live prices, the generation mix, and load to see whether a soft result was the market or your optimizer.
- Validate your forecast's assumptions. Track whether the generation mix and demand are moving the way the forecast assumed, or pulling away from it.
Ko works across all of it. Ask about a spike or an unusual day, and Ko cross-references the benchmark, pulls the live prices, and the generation mix, then explains what’s driving it.
How to view live data
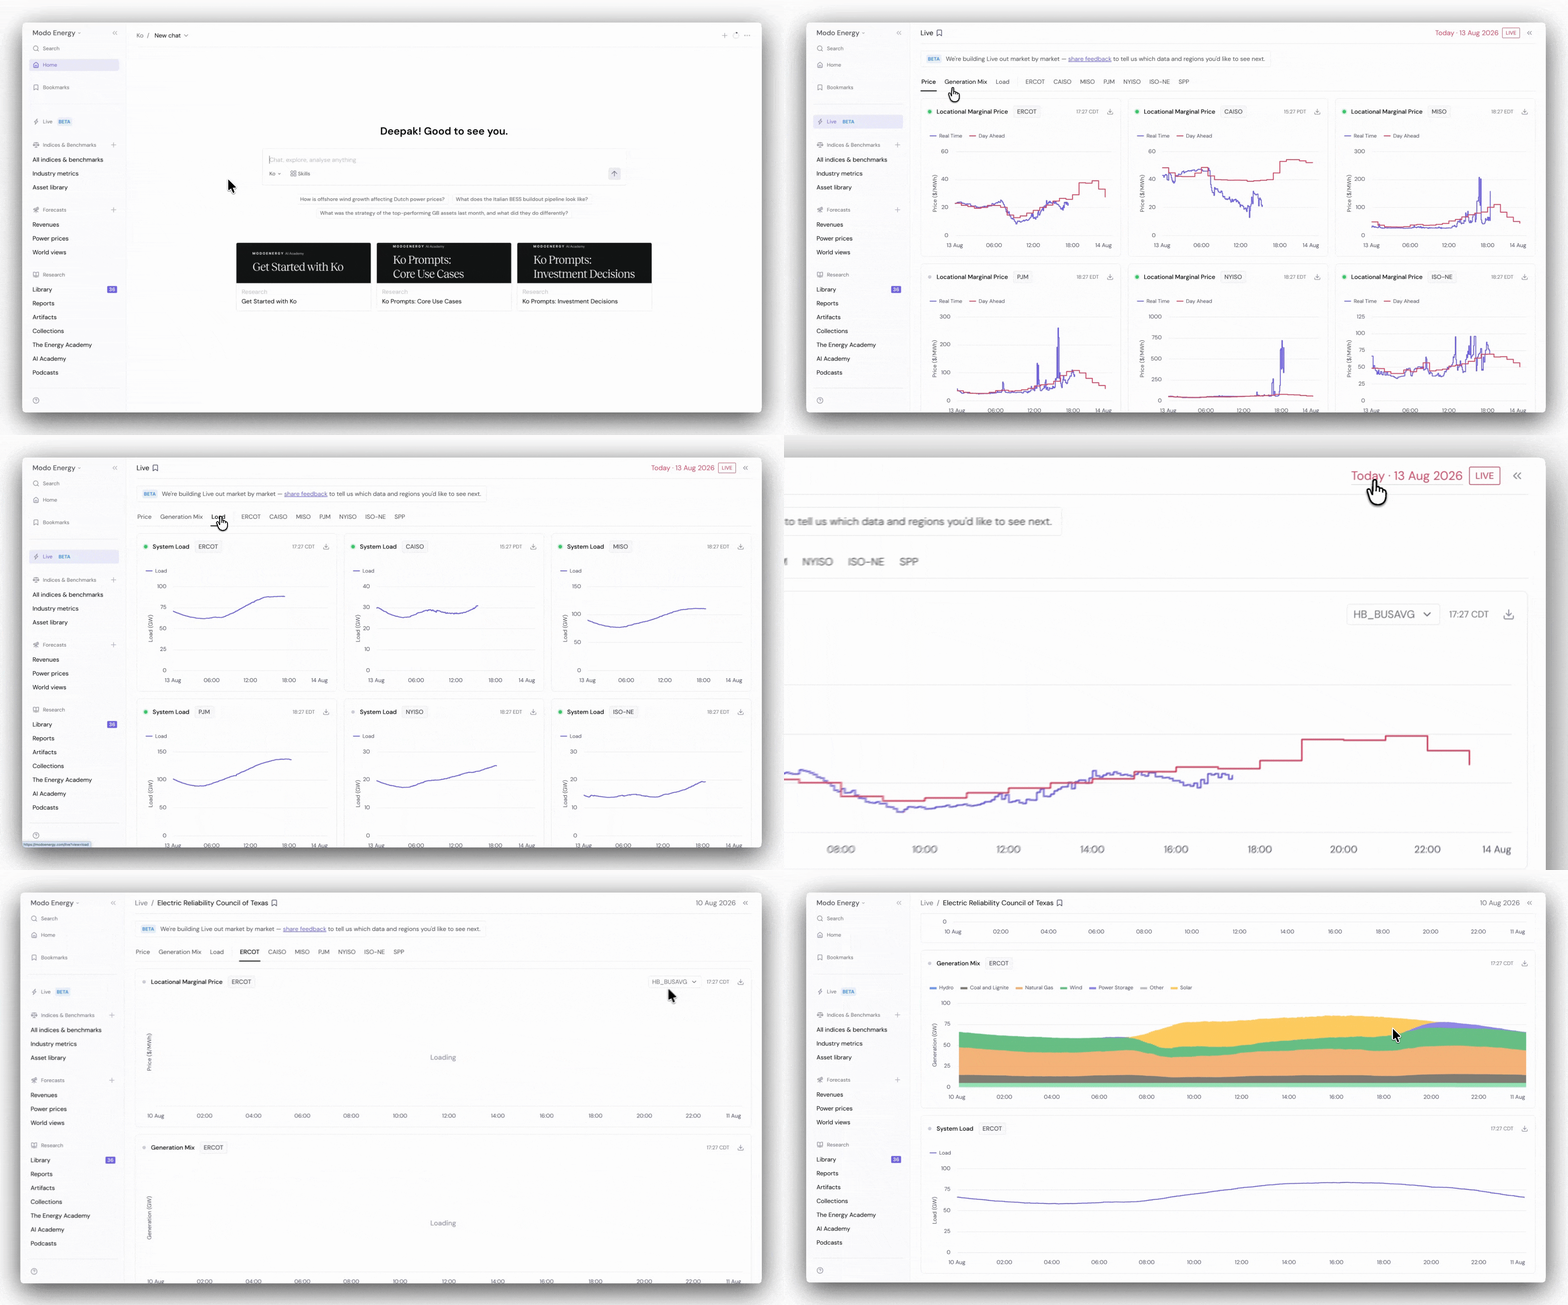
- Select Live in the left sidebar.
- Choose how to view it:
- Switch between energy prices, the generation mix, and load to see one metric across all regions.
- Choose a region (ERCOT, CAISO, SPP, MISO, PJM, NYISO, or ISO-NE) to see all three metrics for that region.
- Use the date picker in the top right to change the day you're viewing.
See live market data on the Modo Energy Terminal →