How to use Ko to analyze solar and wind revenue forecasts
Modo Energy’s solar and wind revenue forecasts help you assess what a project could earn. Configure your assets, grid connection, and supported contract terms, then explore how generation, co-location, market prices, and contracts shape revenues.
Ko brings that analysis into a conversation. You can set up forecasts, analyze completed solar and wind runs, compare asset configurations and contract options, and create a report from your findings.
Key takeaways
- Set up a project-specific forecast and use Ko to understand its revenue drivers.
- Analyze capture prices and cannibalization to assess the value of solar and wind generation.
- Evaluate adding a battery and understand the revenue performance of co-located sites.
- Compare revenues across asset configurations, contract options, and market outlooks.
- Explore Modo Energy’s open methodology and create reports for your team.
Use your own project details in the examples below and name the forecast runs you want to analyze.
1. Configure your project and run a forecast
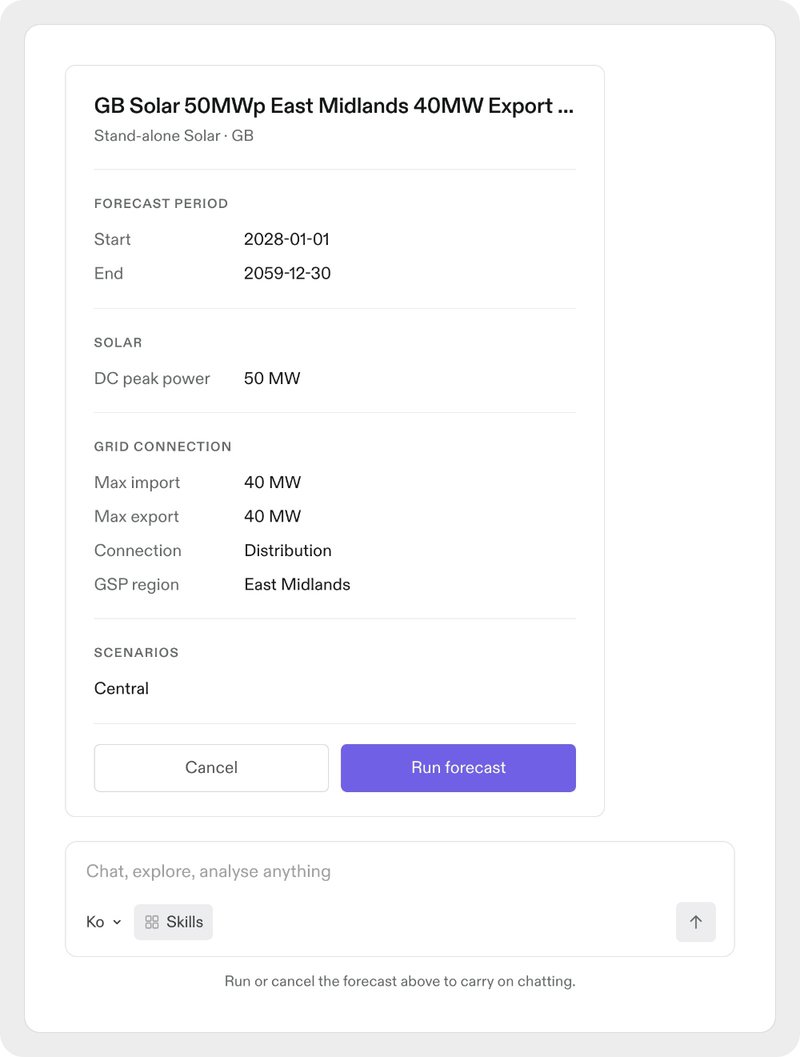
For solar, give Ko the details that define your project: market, location, capacity, and start date. For a co-located battery, add its power, duration, and grid connection limits.
You can configure solar orientation, annual degradation, and export strategy, depending on your market. Use Modo Energy’s modeled generation profile or upload your own through the Terminal.
You can also include supported contract terms, such as PPAs, so the forecast reflects your project’s commercial arrangements.
Try asking Ko:
Review the configuration, then launch the solar forecast in Ko.
For wind, use the Terminal forecast builder and upload a site-specific generation profile. You can ask Ko to explain the available settings before creating the run.
Try asking Ko:
Once the wind forecast completes, give Ko its name or ID to analyze the results.
Full guide to running a forecast here →
2. Analyze capture prices and cannibalization
Use Ko to explore capture prices and cannibalization in your solar or wind forecast.
Assess how the wholesale prices earned during generating hours compare with average wholesale prices, or investigate how growing renewable generation puts pressure on electricity prices during the hours your solar or wind asset generates.
Try asking Ko:

Then go deeper:
Use the findings to understand whether revenue changes reflect generation volumes, market prices, or when your project generates.
3. Assess adding a battery and analyze co-located revenues
Compare forecasts with and without a battery to assess the additional revenue it could bring. Keep the renewable asset, market outlook, grid connection, and renewable contract terms consistent.
Try asking Ko:

You can then explore how the assets operate together. Solar’s export strategy determines whether it always exports, exports at positive prices, or optimizes with the battery.
Wind uses “always export” mode. At a combined wind, solar, and battery site, the battery operates around renewable generation and the shared connection.
Then go deeper:
4. Compare revenues across configurations and market outlooks
Run separate forecasts to test how project design changes affect revenues. You can compare battery sizes, solar degradation assumptions, generation profiles, or connection limits where supported.
Change one input at a time to make the comparison easier to interpret.
Try asking Ko:
You can also test the same project under different market outlooks. Ask Ko which scenarios are available and what changes between them.

Then go deeper:
For wind profile comparisons, check alignment with the forecast’s reference weather year. The wind model uses the uploaded profile directly, so mismatched weather conditions can distort capture prices.
5. Evaluate PPA offers and compare contract revenues
Use Ko to assess a proposed PPA price against forecast market value and compare how different contract arrangements affect your project’s revenues.
Depending on your region, you can compare merchant exposure with a fixed-price power purchase agreement (PPA), a floor, or a cap-and-floor arrangement. Create a separate forecast for each option, keeping the asset configuration and market outlook consistent.
Try asking Ko:
You can then compare those arrangements across available market scenarios to assess the balance between downside protection and exposure to higher prices.
Then go deeper:
You can also investigate individual terms before comparing offers. Test different contract prices, durations, or contracted capacities in separate runs, then ask Ko to explain the revenue differences.
6. Explore the methodology behind your forecast
Ask Ko to explain how Modo Energy models generation, power prices, asset operation, and contract payments. Use the documented methodology to understand the assumptions behind your results and prepare for investment or financing discussions.
Try asking Ko:
Then go deeper:
Follow the sources to investigate a particular assumption or modeling choice. This gives your team a basis for challenging the forecast and explaining the revenue case.
7. Create a report from your forecast analysis
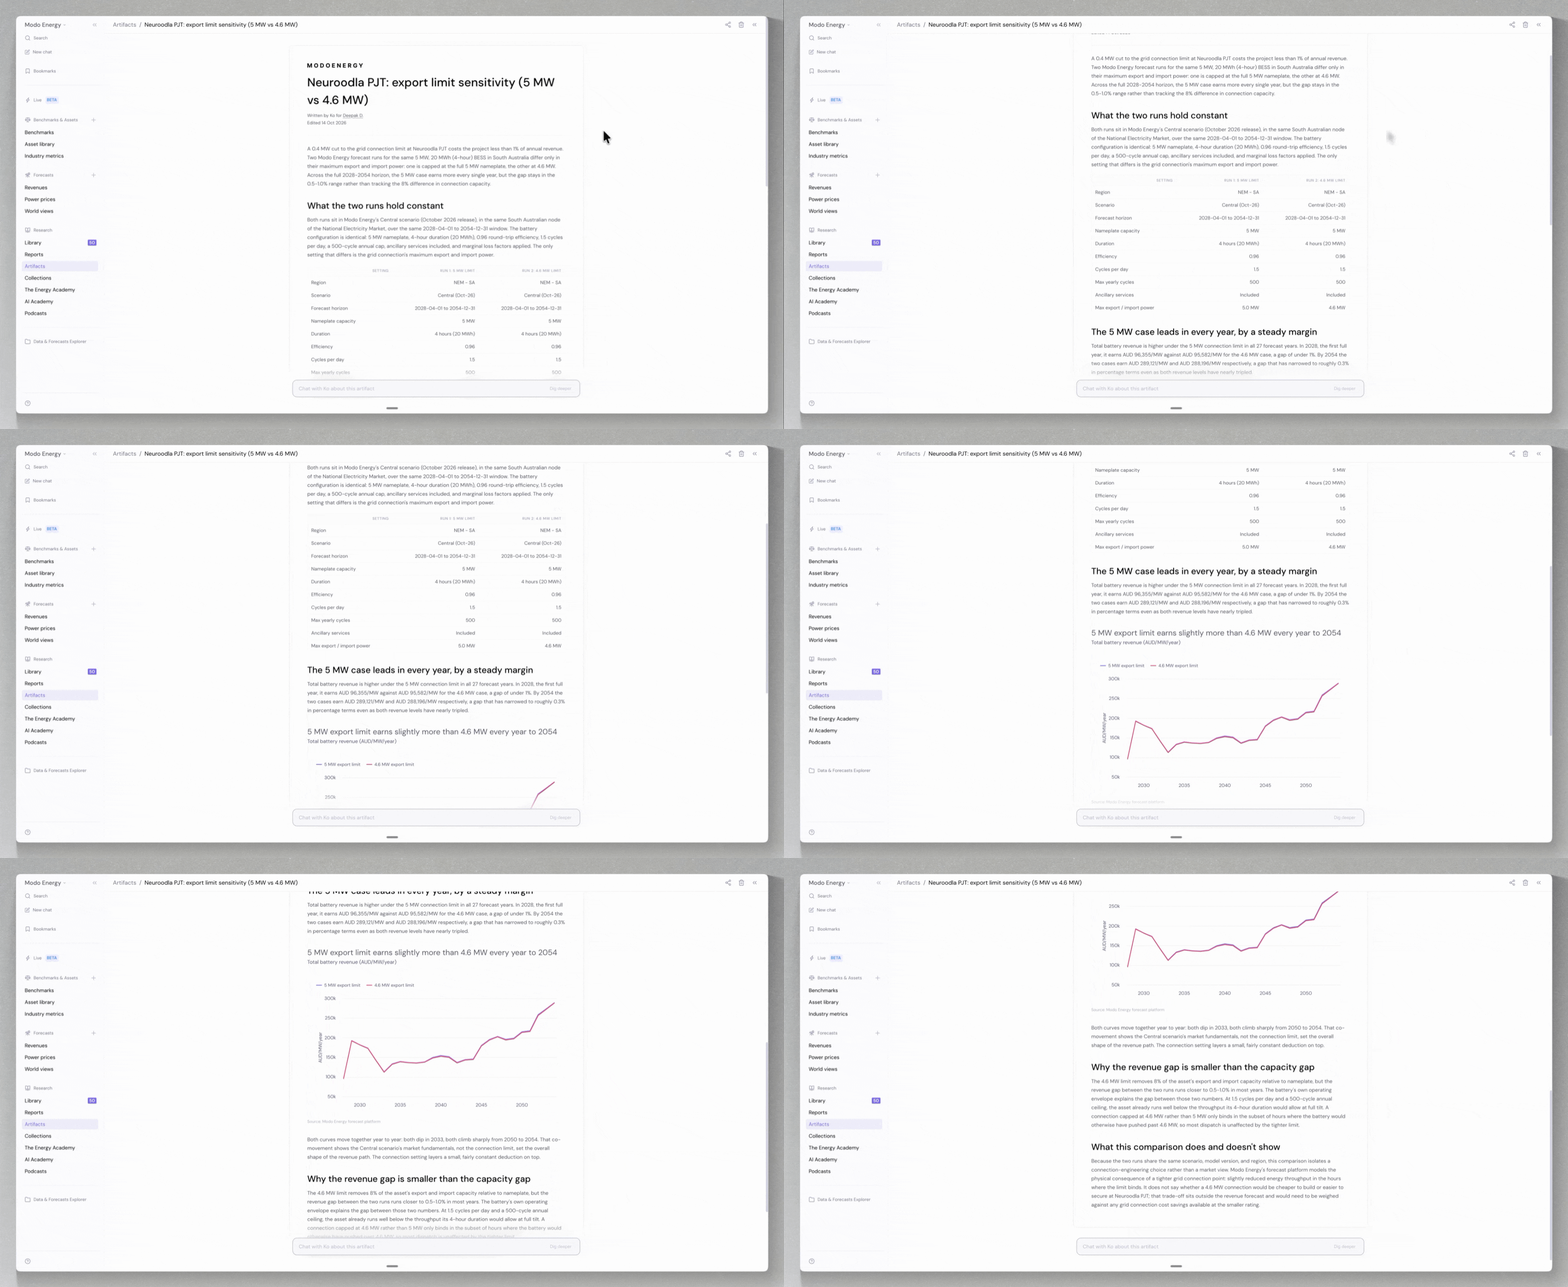
Ask Ko to bring your comparisons into a report. Name the runs to include and explain who will use it.
Try asking Ko:
Then make changes, if needed:
Reports are saved as artifacts. Click View artifact to open one, or return to it through Artifacts in the Terminal’s left sidebar.
Review the sources and configurations, then share the report with your team.