NEM merchant solar revenues fell 19% to $42k/MW/year in September 2026
NEM merchant solar revenues fell 19% to $42k/MW/year in September 2026
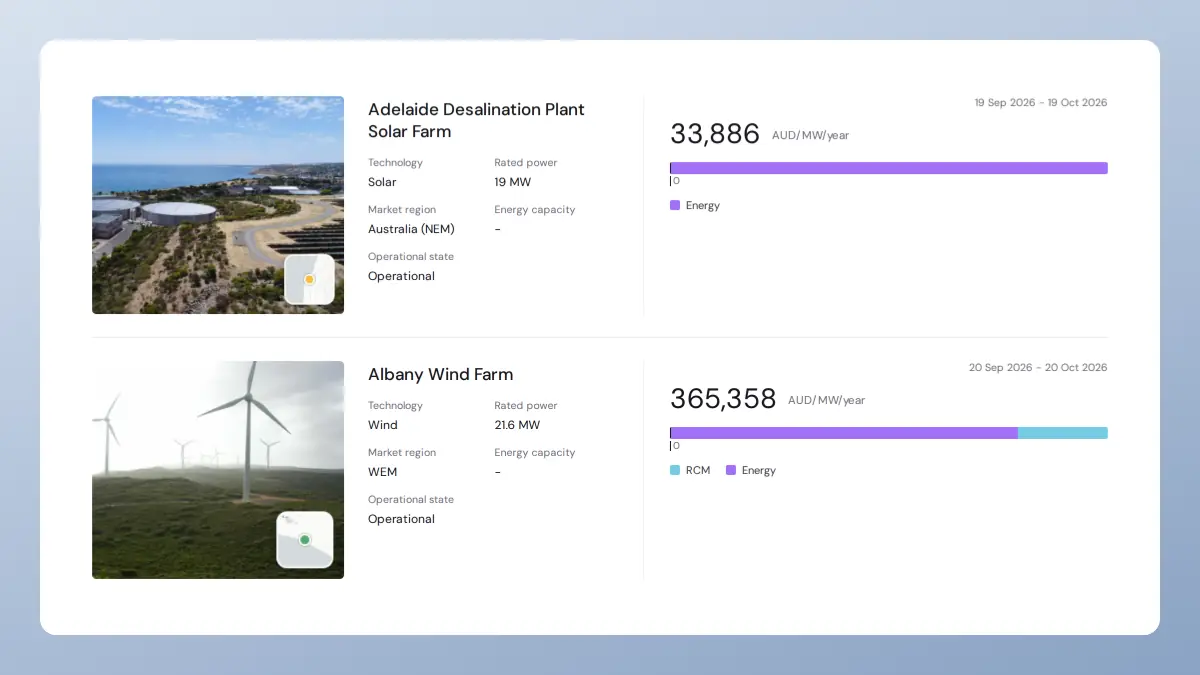
NEM utility-scale solar merchant revenues fell to $41.7k/MW/year in September 2026, as spring brought more solar generation alongside a 21% fall in midday operational demand.
With solar dispatching into increasingly crowded midday periods, the average solar capture price fell 39% to $17/MWh. There were also more negative prices and congestion, so curtailment more than doubled to 22% of available output.
Revenues fell fastest in South Australia and Victoria, where high penetration of both wind and solar drove the most negative prices.
For Modo Energy's solar capture rates methodology, see our intro explainer here. Other related articles include August solar revenues and our coverage of September BESS revenues.
This report covers merchant revenues only, to reflect the underlying merchant market for solar. Most solar assets retain PPAs or LGC contracts that would encourage negative bidding. With negative dispatch excluded, revenue was 10% higher at $45.9k/MW/year.
Executive summary
- Solar revenues fell 19% to $41.7k/MW/year, as more solar generation met weaker midday demand.
- Curtailment more than doubled to 22%, with two-thirds of the increase driven by economic curtailment rather than congestion.
- South Australia and Victoria were hit hardest, as midday prices turned negative. South Australia’s solar revenues fell 67% month-on-month to $23k/MW/year.
- New South Wales led NEM solar revenues at $56k/MW/year, while Queensland also outperformed the southern states.
- Solar economics remained well above September 2025, with revenue 4.4x higher as battery charging tripled year-on-year.
New South Wales and Queensland solar revenues overtook South Australia
New South Wales solar earned $56k/MW/year at a 37% capture rate, both metrics the highest in the NEM. Despite the worst loss factors, it had the shallowest midday average at $27/MWh and the lowest curtailment at 19.0%.
South Australia’s midday price highs disappeared in September. In August, it led NEM solar revenues at $69k/MW/year on the flattest intraday shape; in September it dropped to a third of that. Its fleet curtailed 46% of available output, and the average price was negative from 10 AM to 4 PM.
Queensland had the lowest capture rate at 23%. Its midday sits furthest below its own average among the states that stayed positive. Solar revenues were still higher than South Australia or Victoria, at $32k/MW/year, because that capture is relative to an average RRP of $57/MWh, 51% and 55% above South Australia and Victoria respectively.
Sign up to read this article for free
Unlimited access to our free articles
Monthly access to 2 Global Research articles
Benchmarks, Forecasts, Ko and more